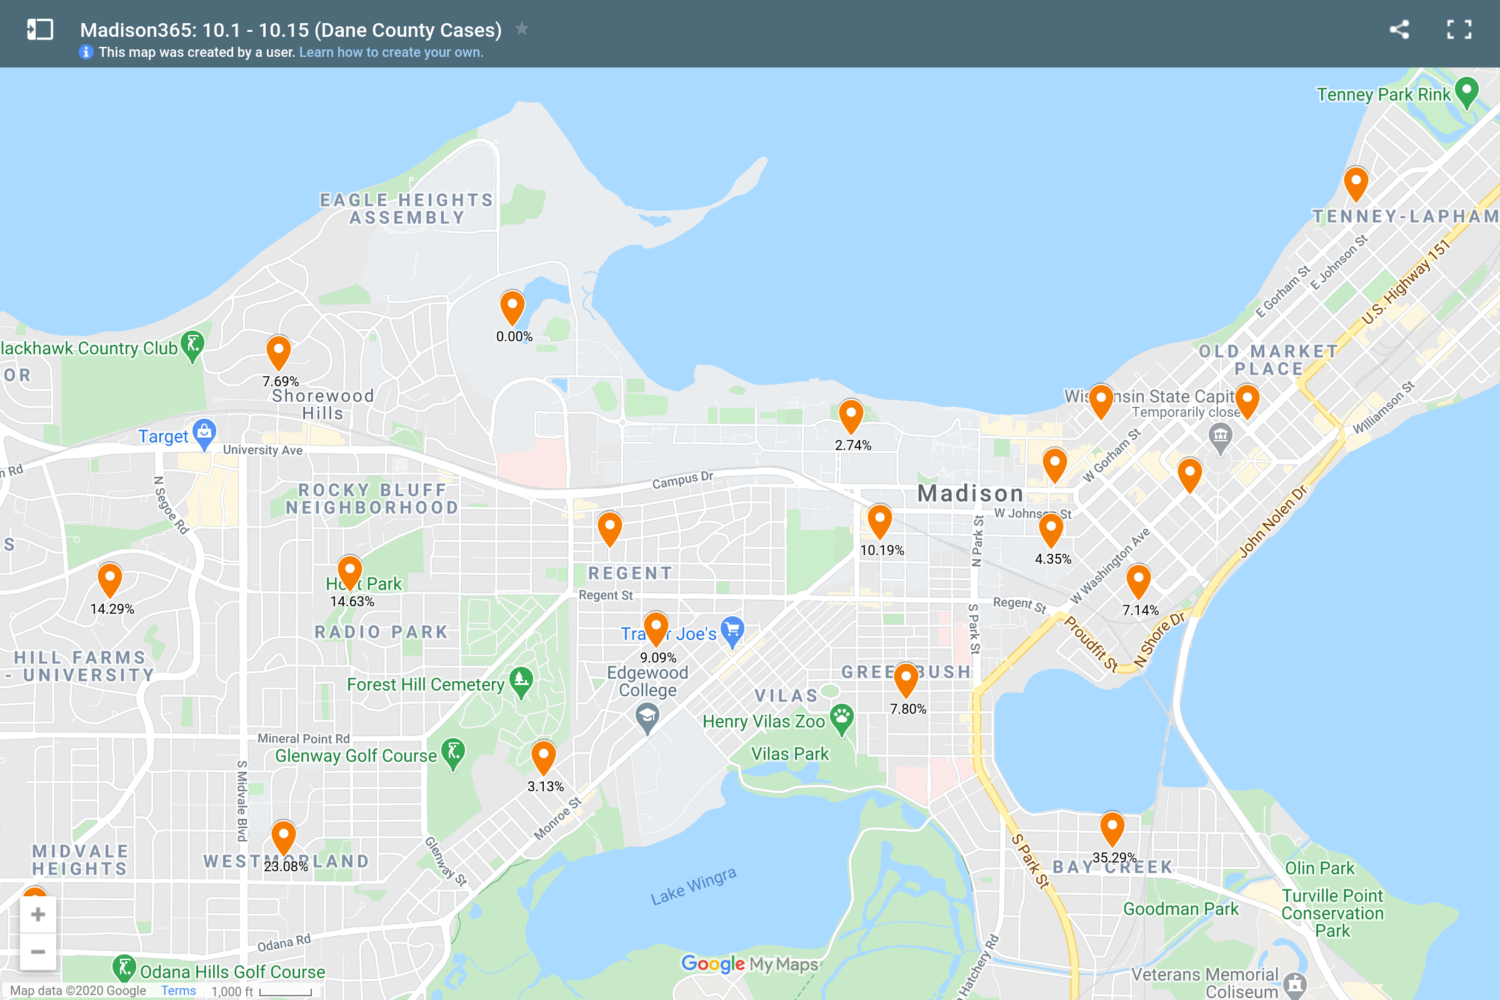
This map shows current total case count for each census tract, as well as the increase in cases over the past two weeks, from January 17 through January 31.
The data behind the map only indicates a number of cases and deaths in a specific tract if there have been five or more. Thirteen tracts that have reported at least five deaths in Dane County since the pandemic began:
| 102.00 | N Sherman Ave/Yahara Riber/ Farwell Dr/Maple Bluff | 12.50% |
| 9.02 | S Franklin Ave/Campus Dr/Regent Dr/N Breese Terrace | 11.26% |
| 32.00 | UW Madison/UW Hospital/Picnic Point/Eagle Heights | 11.11% |
| 106.00 | US 14/Lake Farm Rd/Libby Rd, along Yahara River/Rutland Dunn Town Line Rd/ Sand Hill Rd/Schneider Rd | 10.04% |
| 2.05 | Wexford Village – W Beltline/Old Sauk Rd/N High Pt Rd/Woodland Hills/wexford Park/N Gammon Road | 9.72% |
| 19.00 | Near Eastside/Marquette/Yaharra River | 9.38% |
| 17.05 | Mansion Hill/Langdon St/N Blair St/Law Park/John Nolen Dr /W WIlson/E Main St/S Pickney/NPickney St/Wisconsin AV/Lakeshore Path @ WI Ave to N Blair | 9.21% |
| 137.00 | Verona/Town of Verona | 8.75% |
| 107.01 | S Seminole Hwy/McKee Road/Fish Hatchery Rd/Whalen Rd | 8.70% |
| 109.03 | Valley View Rd/County Rd M/Meadow Rd/Midtown Rd/Shady Oak Lane/County Rd PD | 8.67% |
The data comes from the state Department of Health Services map, which shows current case counts by census tract. The DHS map does not show historical data, however. We are able to provide comparisons between past and current case counts because we’ve been tracking cases in each neighborhood since early May.
Each pin on the map represents a census tract. You can zoom in on the map to find your neighborhood. Clicking or tapping on a pin will allow you to see:
- Description of the neighborhood
- Number of cases as of 1/17
- Number of cases as of 1/31
- Difference in the number of cases between those two dates
- Number of cases per 1,000 residents as of 1/17
- Number of cases per 1,000 residents as of 1/31
- Difference in the number of cases per 1,000 residents between those two dates
- The percentage change between those two dates
- Deaths
Additionally, the percent increase in each tract is visible on the map without clicking the pin — just zoom in to see the increase in cases for each neighborhood.
Coronavirus cases in Dane County have been increasing rapidly, especially in areas beyond Madison.
Based on the current data, the following 10 Dane County tracts had the largest increases from January 17 through January 31:
| 114.01 | Town of Blooming Grove/Milwaukee Street/ I39/I90/county hwy BB/I94 | 12 |
| 114.02 | Token Creek County Park/Portage RD, Town of Burke, Burke, Hoepkers Corners, American PKWY, US 151, High Crossing BLVD | 11 |
| 4.08 | Schroeder RD/S Gammon D/Mineral Point Rd/Whitney Way (Odana-Tokay – W Beltline) | 10 |
| 132.00 | Town of Dane, DeForest, Windsor | 9 |
| 131.00 | Village of Mazomanine | 9 |
| 122.02 | Stoughton | 8 |
| 109.01 | West Middleton/Willows Autumn Ridge/Middleton Junction | 7 |
| 113.01 | Waunakee, Westbridge, Meadowbrook at Pleasant Valley, Centennial Heights, | 7 |
| 4.06 | Watts Rd/Newberry Heights/County RD M/Mid Town Rd | 7 |
| 113.02 | Waunakee Apriport, Castle Crest, Castle, Waunakee Middle & High School, Heritage Elementary, Prairie Additions, Coopers Additions, Village Park | 7 |
| 137.00 | Verona/Town of Verona | 6 |
| 110.00 | Middleton – University Av/Old Middleton Greenway/Woodside Heights Park | 6 |
| 107.02 | Town of Verona/Fitchburg (County M/Whalen Rd/LacyRd) | 6 |
| 116.00 | Sun Prairie, US 151, Bailey RD/Town Hall DR/County RD W/Happy Valley RD/County HWY N, N Bristol St – Partick Marsh Middle School, Brazee Lake, Town Hall Dr, Sun Prairie HS, Buss’s Corner | 6 |
| 14.03 | Fitchburg (Mckee-Post Road-W Beltline-US 14-Syene Rd) | 6 |
| 115.06 | O’Keefe Ave/Sheehan Park/151/Smith’s Crossing Community Park/Sun Prairie | 6 |
| 17.04 | Dane County Courthouse/Capitol Square/Federal Courthouse | 5 |
| 108.00 | Verona | 5 |
| 125.02 | Oregon/Town of Oregon | 5 |
We will continue to publish updated maps weekly.


