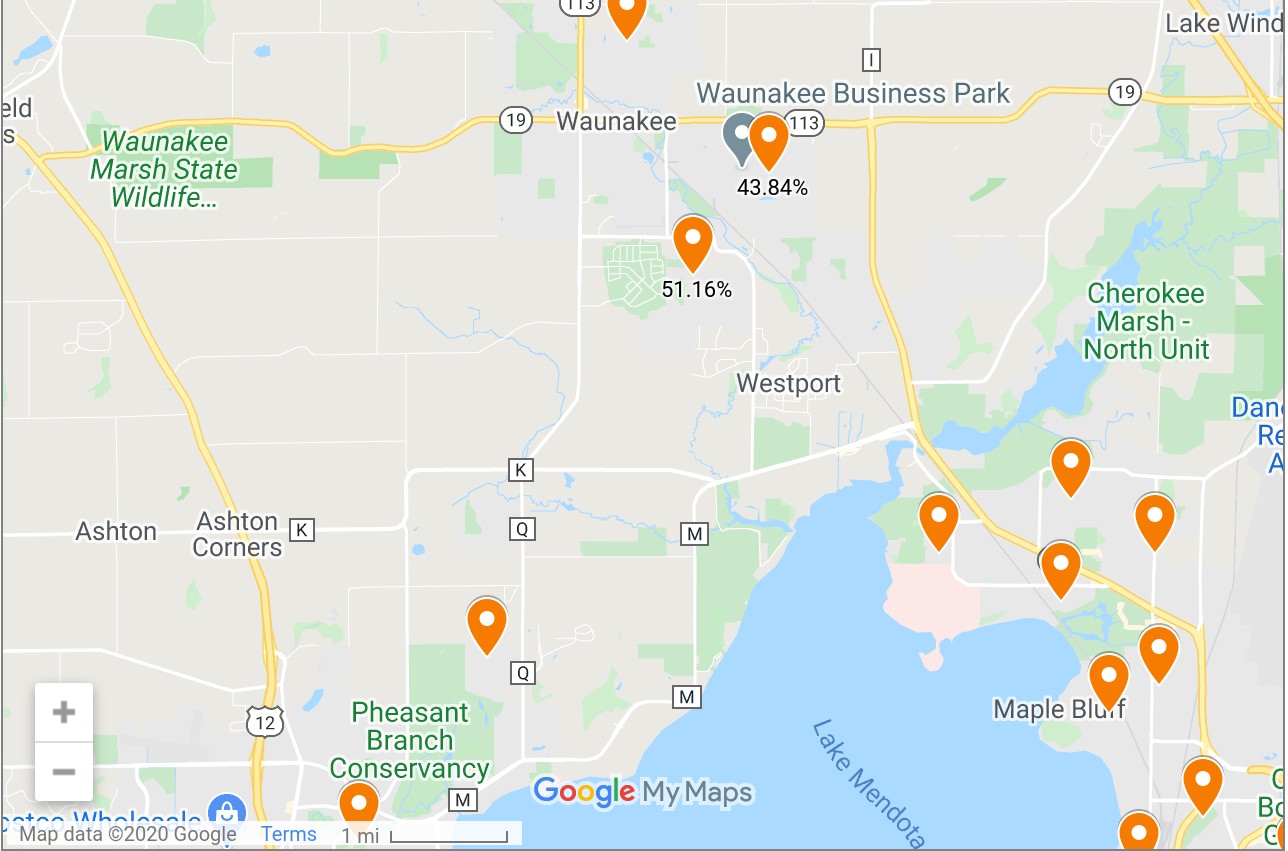
This map shows current total case count for each census tract, as well as the increase in cases over the past two weeks.
The data comes from the state Department of Health Services map, which shows current case counts by census tract. The DHS map does not show historical data, however. We are able to provide comparisons between past and current case counts because we’ve been tracking cases in each neighborhood since early May.
Each pin on the map represents a census tract. You can zoom in on the map to find your neighborhood. Clicking or tapping on a pin will allow you to see:
- Description of the neighborhood
- Number of cases as of 10/22
- Number of cases as of 11/05
- Difference in the number of cases between those two dates
- Number of cases per 1,000 residents as of 10/22
- Number of cases per 1,000 residents as of 11/05
- Difference in the number of cases per 1,000 residents between those two dates
- The percentage change between those two dates
Additionally, the percent increase in each tract is visible on the map without clicking the pin — just zoom in to see the increase in cases for each neighborhood.
Coronavirus cases in Dane County have been increasing rapidly, especially in areas beyond Madison.
Based on the current data, the following 15 county tracts had the largest increases from October 22 through November 5:
- 104.00 (Winnequah Trail/ Healy Lane/ Nichols Rd/ Monona Dr/West Broadway ) – 127.78%
- 15.01 (Ethelyn Park/W-S Beltline/West Broadway) – 92.86%
- 111.01 (Middleton HS Parmenter St/Univ Ave/Allen Blvd/Century Ave) – 89.71%
- 129.00 (Sauk City/Cross Plains/Black Earth) – 86.67%
- 5.01 (Raymond Rd/Verona Rd/W Beltline/S Whitney Way ) – 75%
- 4.08 (Schroeder RD/S Gammon D/Mineral Point Rd/Whitney Way/ W Beltline) – 73.53%
- 23.02 (Harper Rd/Troy Dr/Vera Court/Northport Drive/Kennedy Heights/N Sherman Ave/Trailway St/Maple Bluff Marina) – 71.43%
- 114.01 (Town of Blooming Grove/Milwaukee Street/ I39/I90/county Hwy BB/I94) – 69.08%
- 115.05 (US 151/W Main St/N Bristol St/Sun Prairie) – 64.44%
- 120.01(Cottage Grove/Town of Cottage Grove) – 60.14%
- 1.00 (Old Middleton Gateway/Mendota Beach/Marshcal Park/University AV/Spring Harbor) – 60.00%
- 28.00 – (Monana Dr/Cottage Grove Rd/ S Stoughton Rd/E Dean Ave/Monona Grove High School) – 57.14%
- 6.00 – (Verona Road/McKee Road/W Beltline/Dawley Conservancy Park ) – 56.60%
- 121.00 – (Stoughton/Albion/Dunkirk) – 55.74%
- 131.00 – (Village of Mazomanine ) – 54.90%
We will continue to publish updated maps weekly.


