
Coronavirus cases in Dane County have been increasing rapidly, especially in neighborhoods near the University of Wisconsin campus, and especially recently.
This map shows current total case count for each census tract, as well as the increase in cases over the past two weeks.
The data comes from the state Department of Health Services map, which shows current case counts by census tract. The DHS map does not show historical data, however. We are able to provide comparisons between past and current case counts because we’ve been tracking cases in each neighborhood since early May.
Each pin on the map represents a census tract. You can zoom in on the map to find your neighborhood. Clicking or tapping on a pin will allow you to see:
- Description of the neighborhood
- Number of cases as of 10/15
- Number of cases as of 10/29
- Difference in the number of cases between those two dates
- Number of cases per 1,000 residents as of 10/15
- Number of cases per 1,000 residents as of 10/29
- Difference in the number of cases per 1,000 residents between those two dates
- The percentage change between those two dates
Additionally, the percent increase in each tract is visible on the map without clicking the pin — just zoom in to see the increase in cases for each neighborhood.
On Friday morning, Public Health Madison & Dane County released a new data snapshot showing that in October, 56 percent of new cases were outside Madison, up from 28 percent in September.
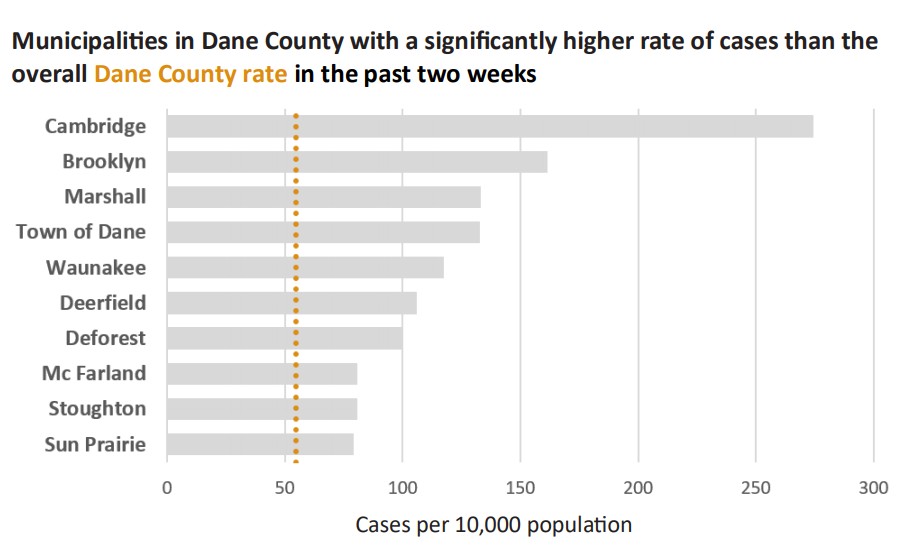
The data snapshot also names ten municipalities whose case increases are significantly higher that Dane County’s. The county increased by 55 cases per 10,000 residents over the past two weeks; the following municipalities had higher increases:
We will continue to update the data in this map at least once per week.


